 Murray Simpson, Ph.D.
By Murray Simpson, Ph.D.
BLOG OVERVIEW: Justifying a gender pay gap of at least 5% under the EU Pay Transparency Directive means identifying objective, gender-neutral factors that explain the gap and confirming that it falls below the 5% threshold once those factors are taken into account. A practical three-phase framework shows how regression analysis can test whether factors such as years of service, time in job, and performance explain the category-wide gap (Phase I), whether individual women are underpaid within specific same-work jobs (Phase II), and whether women are concentrated in lower-paid jobs of equal value (Phase III). Fully closing the gap ultimately requires a combination of justification and targeted remediation, demonstrating that this is technically demanding work. Ahead of the 2027/2028 reporting deadlines, employers should assess whether they have the in-house expertise to undertake this analysis or should engage experienced pay equity consultants.
Under the EU Pay Transparency Directive (the Directive), employers are required to compute gender pay gaps for base pay and for complementary or variable components of pay for each category of worker. Pay gaps of at least 5% require the employer to take one of three actions that include justification of the pay gap, remediation of the pay gap within six months of the pay-gap reporting date, or implementation of a joint pay assessment with workers’ representatives. In this article, we explore what justifying a pay gap means and examine how an employer may proceed in assessing whether a gap in base pay of at least 5% is justified. We will address gaps of at least 5% in complementary or variable components of pay in a subsequent edition of The Navigator.
Let’s assume that a hypothetical employer, We Pay Fairly (WPF), conducted a series of job evaluations to identify jobs of equal value based on the required set of compensable factors identified in the Directive— namely, skills, effort, responsibility, and working conditions. This work culminated in the creation of ten sets of equally valued jobs, each of which was assigned as a worker category. For each of the ten worker categories, WPF calculated the gender-based gap in base pay and discovered a gap of 12,1% that disfavors female workers for the category of Senior Professional.
This worker category includes five jobs: Senior HR Business Partner (Sr HRBP), Senior Financial Analyst (Sr FA), Senior Data Scientist (Sr DS), Senior Product Manager (Sr PM), and Senior Compensation Manager (Sr CM). Workers assigned to a given job have the “same” or “equal” duties and tasks to perform, but the duties and tasks are dissimilar to those of the other four jobs. In other words, each job itself is a “same work” job, but the nature of work differs between the five jobs. The five jobs, in turn, are assigned to the Senior Professional worker category because their job evaluation scores fall within a similar range, allowing them to be considered of “equal value.” In sum, there are five same-work jobs within the equal-value category of Senior Professional.
The goal is to develop a justification analysis plan for WPF’s use in evaluating whether the Senior Professional pay gap of 12,1% is justified. Before doing so, we must understand what the Directive prescribes as justification of a pay gap.
What Does “Justifying” a Pay Gap Mean?
Recital 17 of the Directive states that employers are not precluded from paying workers differently for the same work or work of equal value “on the basis of objective, gender-neutral and bias-free criteria, such as performance and competence.” Justifying a pay gap therefore entails identifying objective, gender-neutral factors that explain why one gender in the worker category of interest is paid, on average, at least 5% more than the other gender and measuring whether the pay gap falls below the 5% threshold after taking the objective, gender-neutral factors into account.
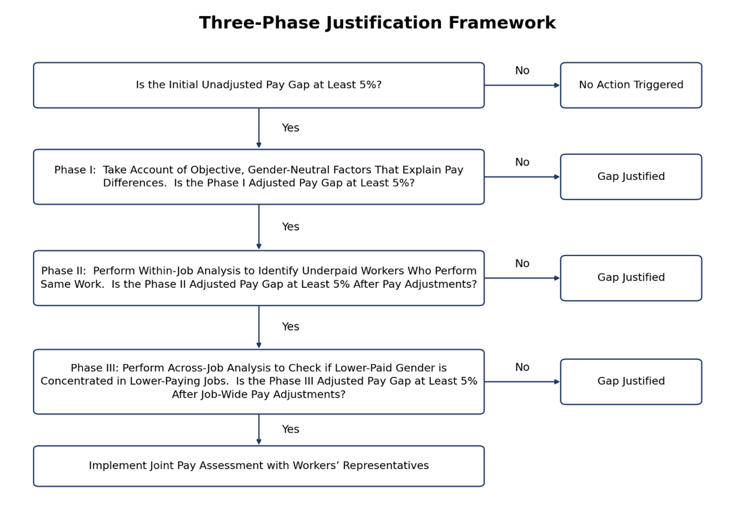
A three-phase justification analysis plan provides a means for WPF to assess whether the 12,1% pay gap for the Senior Professional category is justified. Phase I tests whether objective, gender-neutral factors explain the 12,1% gap. If they do not, then WPF moves into Phase II to analyze each of the five jobs for workers underpaid relative to peers who perform the same work. In Phase III, if needed, WPF considers whether the gap arises, at least in part, because female workers are concentrated in lower-paid jobs among the five that are of equal value based on their job evaluation scores. The flow chart below illustrates the three-phase justification framework.
Phase I: Do Objective, Gender-Neutral Factors Explain the 12,1% Category-Wide Gap?
The principle of equal pay embodied in the Directive requires WPF to provide equal pay to workers who perform equal work or work of equal value. The first phase of the justification analysis plan assesses whether WPF is satisfying the principle of equal pay relative to the “equal value” standard within the Senior Professional worker category. WPF, if it chooses, can in Phase II evaluate whether it is meeting the “equal pay for equal work” standard separately for each of the five jobs represented in the worker category.
WPF recognizes that the category-wide gap of 12,1% is an “unadjusted” pay gap, meaning it is computed simply as the difference in the average base pay levels of female and male workers, expressed as a percentage of the male average. The computation takes no account of any objective, gender-neutral factors that could explain the category-wide difference in average base pay levels between female and male workers.
The question confronting WPF at the start of Phase I is what objective, gender-neutral factors, if any, could explain the higher average base pay of male senior professionals. WPF values company-specific professional competence and recognizes that such competence among its senior staff is gained through overall experience at WPF (years of service) and experience in the job (time in job). WPF also has a pay-for-performance compensation philosophy and awards higher performing senior staff with larger merit increases, doing so under a performance management process that recently passed a third-party audit which identified no gender-based differences in performance ratings assigned over the past three years. WPF, therefore, seeks to account for years of service, time in job, and performance as objective, gender-neutral factors in computing an adjusted pay gap for the Senior Professional category.
To calculate the adjusted pay gap, WPF first confirms that the number of Senior Professional staff and the numbers of female and male workers among the staff are sufficient to undertake a regression-based statistical analysis. WPF proceeds by specifying a regression model in which the base pay of workers in the Senior Professional category is a function of their respective years of service, time in job, and average performance over the past three years. The model also allows for the possibility that base pay may be a function of gender.
WPF compiles a data set comprising one record for each Senior Professional worker that reports the worker’s gender along with the worker’s base pay rate, years of service, and time in job as of December 31 of the previous calendar year, and average performance derived from up to three most recent annual performance ratings. It then utilizes these data records to fit a version of the regression model that reports an estimate of the adjusted base pay gap between female and male workers (stated as a percentage difference), after accounting for differences in base pay among Senior Professional staff attributable to differences in their years of service, time in job, and average performance as well as their being grouped by different jobs within the Senior Professional category.
Next, WPF computes the upper and lower bounds of an interval around the estimated adjusted base pay gap for which it is 95% confident that the true adjusted base pay gap falls between those two numbers, which themselves are stated as percentages. If the 5% threshold falls within the interval, then the true value of the adjusted base pay gap may be higher than or lower than the 5% threshold (and possibly even 0% if the lower bound extends below 0%), but WPF cannot draw an unequivocal conclusion. Only if the upper bound of the interval is less than 5% can WPF conclude with 95% confidence that the initial, unadjusted base pay gap of 12,1% is explained by the objective, gender-neutral factors of years of service, time in job, and average performance and, because of this justification, no remediation or joint pay assessment is triggered. On the other hand, if the upper bound is at least 5%, then the objective, gender-neutral factors have not provided sufficient justification for the initial 12,1% gap and WPF must proceed to Phase II of the justification analysis plan.
In this instance, the upper bound for the 95% confidence interval is 8,2%, and WPF moves to Phase II because the three factors included in the category-wide regression model do not sufficiently explain the initial unadjusted pay gap of 12,1%.
Phase II: Within Any Same-Work Job, Are Senior Professional Females Underpaid?
To commence Phase II, WPF confirms, in the same manner as it did in Phase I, that the number of Senior Professional staff and the numbers of female and male workers among the staff in each of the five Senior Professional jobs are sufficient to undertake a regression-based statistical analysis separately for each job. If this were not the case because one or more of the jobs had too few staff in total or too few of a given gender to reliably estimate a regression model, then WPF would need to undertake an alternative small-group analysis for each such job. Small-group analyses are beyond the scope of this article but will be equally important as regression modeling for employers seeking to justify pay gaps under the Directive.
WPF estimates the same regression model utilized in Phase I for the category-wide analysis but does so separately for each job. For three jobs (Sr HRBP, Sr FA and Sr CM), the upper bound of the 95% confidence interval falls below 5%, implying that differences in base pay between female and male workers in each job are justifiably explained by differences in years of service, time in job, and average performance. This is not the case for the Sr PM and Sr DS jobs where the upper bound surpasses 5%.
WPF continues its investigation by re-estimating the regression model for the Sr PM and Sr DS jobs, retaining the three objective, gender-neutral factors in the model but removing gender as a possible explanatory factor. It then uses each job-specific model with its estimates of the separate influences of years of service, time in job, and average performance on base pay to calculate the base pay level predicted by the model for each Sr PM or Sr DS worker. WPF then identifies each female worker in these two jobs whose actual base pay level is more than some previously determined threshold amount below her predicted base pay level (where the threshold amount is technically stated as a number of standard errors, for example, one standard error below predicted). For each identified female worker, WPF calculates the euro-denominated pay adjustment required to raise the worker’s actual base pay level to the threshold amount (for example, to one standard error below predicted).
WPF returns to the category-wide regression model from Phase I and re-estimates the model with the base pay adjustments of the identified female workers in the Sr PM and Sr DS jobs taken into account. If the upper bound of the 95% confidence interval constructed around the newly estimated adjusted pay gap for the Senior Professional category falls below 5%, then Phase II ends with WPF concluding that the initial unadjusted pay gap of 12,1% can be explained, in part, by differences in years of service, time in job, and average performance between female and male workers, but remediation is required in the Sr PM and Sr DS jobs to fully close the gap. However, in this instance, the upper bound still exceeds 5%, but has declined from 8,2% to 6,3%, leading WPF to conclude that the remaining base pay disparity is between same-work jobs, rather than within the jobs. As such, it proceeds to Phase III of the justification analysis plan.
Phase III: Are Senior Professional Females Concentrated in Lower-Paying Same-Work Jobs?
For Phase III, WPF first computes the average base pay level for female and male workers collectively in each of the five jobs in the Senior Professional category and does so for the Sr PM and Sr DS jobs with the base pay adjustments for female workers identified in Phase II included. WPF also retrieves the job evaluation score of each job from the series of job evaluations it previously conducted. Although the jobs were grouped together in the Senior Professional worker category, their job evaluation scores fell within a range of values; some jobs scored higher than others based on the four compensable factors that were evaluated.
WPF estimates a simple linear regression model that posits average base pay as a function of job evaluation score, recognizing that it will need to interpret the results with caution given they are based on a small number of jobs. The regression model has moderate explanatory power as demonstrated by a key regression statistic that reports approximately 68% of the variability in average base pay levels is explained by the job evaluation scores.
Furthermore, the simple regression model yields the slope and intercept of a line that relates job evaluation score to average base pay. WPF plots the line on a graph (with job evaluation score on the horizontal x-axis and average base pay on the vertical y-axis). It also plots as points on the graph the average base pay level of each Senior Professional job vertically above the job’s corresponding job evaluation score. These points form a scatter plot around the line. The line itself represents the average base pay level predicted by the regression model for a given job evaluation score. If the point on the scatter plot representing a job is vertically above the line in reference to its job evaluation score, then the average pay level of the job is above the level predicted by the model. If the point is vertically below the line, then the job’s average pay level is below that predicted by the model. The graph is depicted below, showing both the regression line that identifies the predicted average base pay level for a given job evaluation score and the scatter plot of average base pay levels for the five jobs in reference to their respective job evaluation scores.
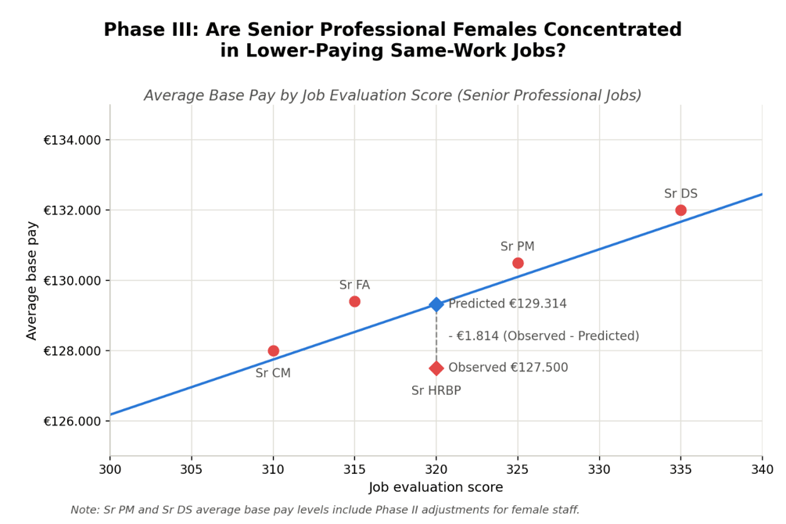
WPF finds that the scatter plot aligns reasonably well with the upward slope of the plotted line, meaning that jobs with somewhat higher job evaluation scores also have somewhat higher average pay levels. The average pay levels for four of the five jobs are close to, but slightly above, the plotted line. The job of Sr HRBP, however, has an average pay level that sits vertically much lower than its predicted level on the regression line, even though its job evaluation score is the middlemost score of the five jobs. WPF checks the gender composition of the Sr HRBP job and finds 75% of its staff are female.
Female and male staff in the Sr HRBP job are paid equitably in comparison to one another according to the Phase II analysis when differences in years of service, time in job, and average performance are considered. However, they all are paid lower, on average, than the Sr HRBP job warrants based on its job evaluation score and the level of average base pay predicted by the regression model. The relatively lower average base pay level of the Sr HRBP job compared to the other four jobs and its predominantly female composition likely explain why WPF was unable to fully close the unadjusted pay gap of 12,1% at the end of Phase II.
To close the final part of the gap, WPF must consider raising the pay of all staff, female and male, in the Sr HRBP job such that the average base pay level approximates the predicted level from the regression model. WPF computes the euro-denominated difference between the predicted and actual average base pay levels for the Sr HRBP job (€1.814) and multiplies that difference by the number of Sr HRBP staff. This total euro-denominated amount represents 4,5% of the annual base pay budget for the Sr HRBP job.
Given current financial constraints, WPF elects to test whether justified pay differences based on years of service, time in job, and average performance in combination with an across-the-board 4,0% increase in the base pay rates of Sr HRBP staff and Phase II pay adjustments for identified female workers in the Sr PM and Sr DS jobs yields a category-wide adjusted pay gap for Senior Professionals that is less than 5%.
To do so, WPF returns once again to the category-wide regression model from Phase I and re-estimates the model with the across-the-board 4,0% base pay adjustments for all Sr HRBP staff and the base pay adjustments of the identified female workers in the Sr PM and Sr DS jobs taken into account. The estimated model yields an upper bound for the 95% confidence interval constructed around the newly estimated adjusted pay gap for the Senior Professional category of 4,7%, a value that falls below 5%. WPF concludes from this test that the initial unadjusted pay gap of 12,1% can be explained in part by differences in years of service, time in job, and average performance between female and male workers, but remediation in the form of the tested pay adjustments for (i) select female workers in the Sr PM and Sr DS jobs and (ii) all workers in the Sr HRBP job is required to fully close the gap.
Conclusion
As demonstrated above, justifying and, if necessary, remediating a gender pay gap of at least 5% is a challenging endeavor that requires careful planning, proper methodological development, and a strong set of quantitative skills. As employers prepare for the first round of pay-gap reporting in 2027 (or 2028 for some EU member states), they should assess, as part of their readiness plan, whether internal staff are prepared to undertake this work or experienced pay equity consultants should be retained to provide expert advice.
DCI Consulting helps employers turn complex EU Pay Transparency requirements into clear, defensible pay decisions before reporting becomes mandatory. We partner with your organization to establish or review worker categories, conduct required gender pay gap analyses, develop targeted remediation strategies, and provide guidance on right to information requests. Visit our EU Pay Transparency Directive page to learn how your organization can prepare to confidently meet upcoming deadlines and subsequent reporting requirements.